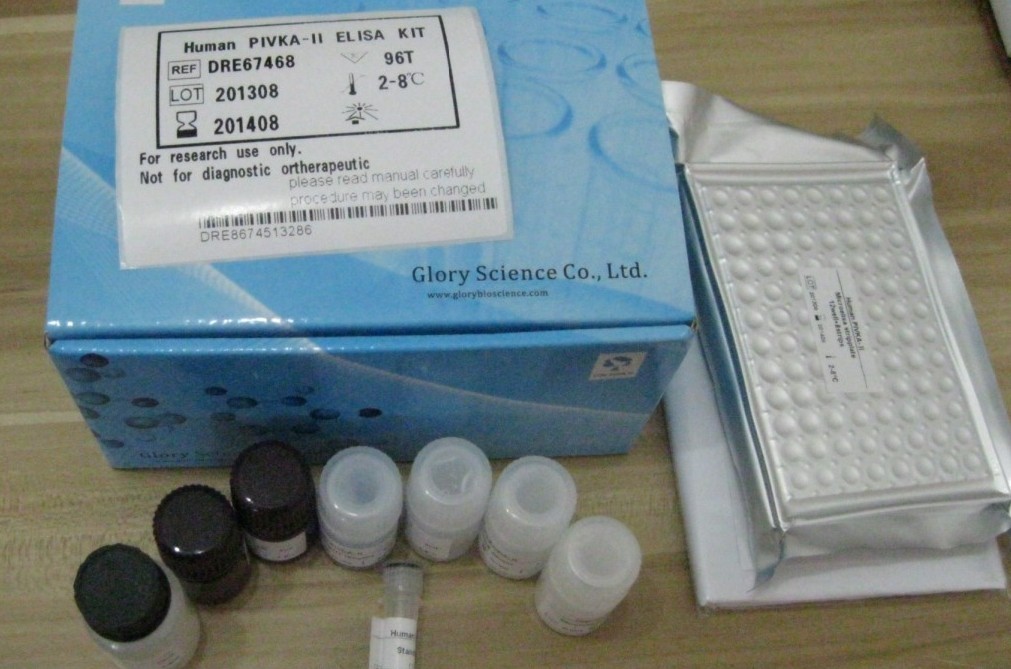
Description
SKU B0748
Product details
| Purpose | This assay employs the quantitative sandwich enzyme immunoassay technique. |
| Detection Method | Colorimetric |
| Specificity | This assay has high sensitivity and excellent specificity for detection of Bovine MRPL43. |
| Cross-Reactivity (Details) | Limited by current skills and knowledge, it is impossible for us to complete the cross-reactivity detection between the target antigen and all analogues for other species. Therefore, cross reaction may still exist. |
| Sensitivity | The sensitivity of this assay, or Lower Limit of Detection (LLD), was defined as the lowest protein concentration that could be differentiated from zero. It was determined as the mean O.D value of 20 replicates of the zero standard added by their three standard deviations. |
| Components |
|
| Material not included |
|
Application Details
| Application Notes |
|
| Sample Volume | 50-100 µL |
| Assay Time | 1 – 4.5 h |
| Plate | Pre-coated,Strips (12 x 8) |
| Protocol | Antibody specific for MRPL43 has been pre-coated onto a microplate. Standards and samples are pipetted into the wells and any MRPL43 present is bound by the immobilized antibody. After removing any unbound substances, a biotin-conjugated antibody specific for MRPL43 is added to the wells. After washing, avidin conjugated Horseradish Peroxidase (HRP) is added to the wells. Following a wash to remove any unbound avidin-enzyme reagent, a substrate solution is added to the wells and color develops in proportion to the amount of MRPL43 bound in the initial step. The color development is stopped and the intensity of the color is measured. |
| Reagent Preparation |
Note:
|
| Sample Collection |
|
| Assay Procedure |
Note:
|
| Calculation of Results | Average the duplicate readings for each standard and sample and subtract the average zero standard optical density. Create a standard curve by reducing the data using computer software capable of generating a four parameter logistic (4-PL) curve fit. As an alternative, construct a standard curve by plotting the mean absorbance for each standard on the x-axis against the concentration on the y-axis and draw a best fit curve through the points on the graph. The data may be linearized by plotting the log of the target antigen concentration versus the log of the O.D. and the best fit line can be determined by regression analysis. This procedure will produce an adequate but less precise fit of the data. If samples have been diluted, the concentration read from the standard curve must be multiplied by the dilution factor. |
| Assay Precision | Intra-assay precision (precision within an assay): Three samples of known concentration were tested twenty times on one plate to assess precision. Inter-assay precision (precision between assays): Three samples of known concentration were tested in twenty assays to assess precision.
|
| Restrictions | For Research Use only |
Handling
| Precaution of Use | The Stop Solution provided with this kit is an acid solution. Wear eye, hand, face and clothing protection when using this material. |
| Handling Advice |
|
| Storage | 4 °C/-20 °C |
| Storage Comment | May be stored at 2-8°C for up to 1 month. For long term storage, please store at -20°C. Try to keep assay plate in a sealed aluminium foil bag and avoid dampness. |
| Expiry Date | 6 months |
Alternatives
Reactivities Human , Mouse (Murine)


Reviews
There are no reviews yet.